Milestones in reach
Career summary
matches in our database| Format | M | Runs | Avg | SR | HS | 100s/50s | Wkts | Econ | BBI |
|---|---|---|---|---|---|---|---|---|---|
| Test since 2005 | 6 | 218 | 36 | 50 | 67 | 0/2 | — | — | — |
| ODI since 2005 | 23 | 516 | 30 | 91 | 123 | 1/2 | 1 | 4.6 | 1/17 |
| T20I since 2007 | 15 | 183 | 26 | 127 | 36 | 0/0 | 1 | 8.6 | 1/13 |
| T20 since 2003 | 259 | 4,938 | 37 | 129 | 90 | 0/34 | 25 | 8.4 | 4/13 |
T20: Ball-by-ball data covers 187 of 259 matches; batting and bowling figures count those.
About Brad Hodge
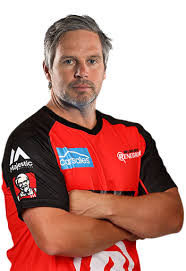
Brad Hodge is a batter (right-hand bat, right-arm off-break) who played for Australia. Our records hold 303 of his matches, 2003–2018.
In T20 cricket (259 matches): 4,938 T20 runs at an average of 37 and a strike rate of 129 and 34 fifties; 25 wickets at an economy of 8.4 (best 4/13).
Brad Hodge has captained Adelaide Strikers in 17 matches.
Teams: Melbourne Renegades, Adelaide Strikers, St Kitts and Nevis Patriots, Peshawar Zalmi, Guyana Amazon Warriors and others.
In T20s the strike rate is 114 in the powerplay and 170 at the death.
Against pace the T20 strike rate is 135, against spin 116.
Wikipedia: Brad Hodge
Teams
 MR
 AS
 SN
 PZ
 GA
 WE
 RR
 AU
 ML
 AU
 BD
Questions about Brad Hodge
How many runs has Brad Hodge scored?
Brad Hodge's runs by format — T20: 4,938, ODI: 516, T20I: 183, Test: 218.
How many runs has Brad Hodge scored in the Indian Premier League?
In the Indian Premier League, Brad Hodge has 1,400 runs in 67 matches at an average of 33, highest score 73, plus 17 wickets.
What is Brad Hodge's highest score?
Brad Hodge's highest scores — T20: 90, ODI: 123, T20I: 36, Test: 67 (* not out).
How many wickets has Brad Hodge taken?
Brad Hodge's wickets by format — T20: 25 (best 4/13), ODI: 1 (best 1/17), T20I: 1 (best 1/13).
Which teams has Brad Hodge played for?
Melbourne Renegades, Adelaide Strikers, St Kitts and Nevis Patriots, Peshawar Zalmi, Guyana Amazon Warriors, Wellington, Rajasthan Royals, Australia.
How old is Brad Hodge?
Brad Hodge was born on 1974-12-29 and is 51 years old.
Batting
| Inn | Runs | Avg | SR | HS | 100s | 50s | 4s | 6s | Ducks | Dot % | Balls/boundary |
|---|---|---|---|---|---|---|---|---|---|---|---|
| 7 | 218 | 36 | 50 | 67 | 0 | 2 | 29 | 1 | 0 | 75 | 15 |
Against pace and spin
| Runs | Balls | Outs | Avg | SR | |
|---|---|---|---|---|---|
| Pace | 74 | 136 | 2 | 37 | 54 |
| Spin | 19 | 30 | 0 | — | 63 |
How the wickets fell
| Inn | Runs | Avg | SR | HS | 100s | 50s | 4s | 6s | Ducks | Dot % | Balls/boundary |
|---|---|---|---|---|---|---|---|---|---|---|---|
| 19 | 516 | 30 | 91 | 123 | 1 | 2 | 43 | 12 | 2 | 50 | 10 |
Against pace and spin
| Runs | Balls | Outs | Avg | SR | |
|---|---|---|---|---|---|
| Pace | 167 | 188 | 7 | 24 | 89 |
| Spin | 96 | 134 | 6 | 16 | 72 |
How the wickets fell
| Inn | Runs | Avg | SR | HS | 100s | 50s | 4s | 6s | Ducks | Dot % | Balls/boundary |
|---|---|---|---|---|---|---|---|---|---|---|---|
| 11 | 183 | 26 | 127 | 36 | 0 | 0 | 10 | 7 | 0 | 28 | 8 |
By phase (T20)
| Runs | Balls | Outs | SR | |
|---|---|---|---|---|
| Powerplay (1–6) | 9 | 8 | 0 | 113 |
| Middle (7–15) | 115 | 90 | 2 | 128 |
| Death (16–20) | 59 | 46 | 5 | 128 |
Against pace and spin
| Runs | Balls | Outs | Avg | SR | |
|---|---|---|---|---|---|
| Pace | 100 | 75 | 4 | 25 | 133 |
| Spin | 61 | 58 | 2 | 31 | 105 |
How the wickets fell
| Inn | Runs | Avg | SR | HS | 100s | 50s | 4s | 6s | Ducks | Dot % | Balls/boundary |
|---|---|---|---|---|---|---|---|---|---|---|---|
| 184 | 4,938 | 37 | 129 | 90 | 0 | 34 | 443 | 176 | 14 | 37 | 6 |
By phase (T20)
| Runs | Balls | Outs | SR | |
|---|---|---|---|---|
| Powerplay (1–6) | 1,263 | 1,105 | 35 | 114 |
| Middle (7–15) | 2,312 | 1,915 | 64 | 121 |
| Death (16–20) | 1,363 | 801 | 36 | 170 |
Against pace and spin
| Runs | Balls | Outs | Avg | SR | |
|---|---|---|---|---|---|
| Pace | 2,747 | 2,037 | 75 | 37 | 135 |
| Spin | 1,513 | 1,307 | 39 | 39 | 116 |
How the wickets fell
Best innings
Dismissed most often by
Bowling
| Inn | Balls | Runs | Wkts | Avg | Econ | SR | BBI | 4w | 5w | Maidens | Dot % |
|---|---|---|---|---|---|---|---|---|---|---|---|
| 3 | 66 (11) | 51 | 1 | 51 | 4.6 | 66 | 1/17 | 0 | 0 | 0 | 45 |
| Inn | Balls | Runs | Wkts | Avg | Econ | SR | BBI | 4w | 5w | Maidens | Dot % |
|---|---|---|---|---|---|---|---|---|---|---|---|
| 3 | 30 (5) | 43 | 1 | 43 | 8.6 | 30 | 1/13 | 0 | 0 | 0 | 43 |
By phase (T20)
| Balls | Runs | Wkts | Econ | |
|---|---|---|---|---|
| Powerplay (1–6) | 12 (2) | 17 | 1 | 8.5 |
| Middle (7–15) | 18 (3) | 26 | 0 | 8.7 |
| Inn | Balls | Runs | Wkts | Avg | Econ | SR | BBI | 4w | 5w | Maidens | Dot % |
|---|---|---|---|---|---|---|---|---|---|---|---|
| 46 | 500 (83.2) | 697 | 25 | 28 | 8.4 | 20 | 4/13 | 1 | 0 | 0 | 31 |
By phase (T20)
| Balls | Runs | Wkts | Econ | |
|---|---|---|---|---|
| Powerplay (1–6) | 48 (8) | 75 | 2 | 9.4 |
| Middle (7–15) | 390 (65) | 549 | 19 | 8.4 |
| Death (16–20) | 62 (10.2) | 73 | 4 | 7.1 |
Best bowling
Most frequent victims
Seasons
Matches
| vs Adelaide Strikers Big Bash League · 22 Jan 2018 | 30* (18) |
| vs Perth Scorchers Big Bash League · 08 Jan 2018 | did not bat or bowl |
| vs Melbourne Stars Big Bash League · 06 Jan 2018 | 4 (5) |
| vs Sydney Sixers Big Bash League · 03 Jan 2018 | did not bat or bowl |
| vs Perth Scorchers Big Bash League · 29 Dec 2017 | 3 (10) |
| vs Brisbane Heat Big Bash League · 23 Dec 2017 | 9* (4) |
| vs Hobart Hurricanes Big Bash League · 21 Dec 2017 | 22* (14) |
| vs Sydney Thunder Big Bash League · 18 Jan 2017 | 39 (32) · 0/8 (1) |
| vs Melbourne Renegades Big Bash League · 16 Jan 2017 | 26 (20) |
| vs Melbourne Stars Big Bash League · 10 Jan 2017 | 17 (22) |
| vs Hobart Hurricanes Big Bash League · 06 Jan 2017 | 30 (20) |
| vs Hobart Hurricanes Big Bash League · 02 Jan 2017 | 55 (45) |