BB
Big Bash (State Competition)
 Australia
Teams & honours
Titles


Best players
MMatches played this season.PointsMVP points, the IPL Most Valuable Player scheme: 3.5 per wicket, 1 per dot ball, 2.5 per four, 3.5 per six, 2.5 per catch or stumping. Summed over the season.
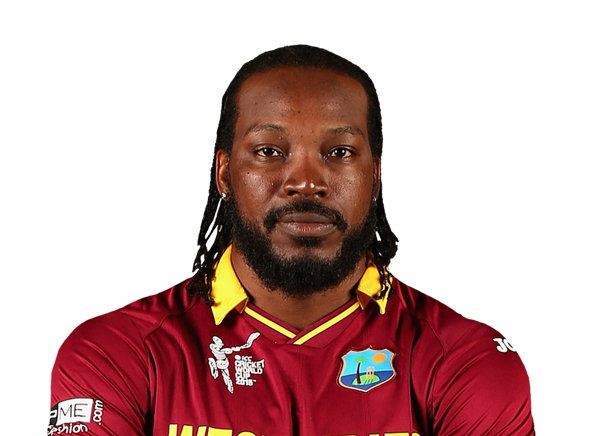
Chris Gayle
WA · 182 runs · 1 wkt
5126
D
Daniel Harris
SOA · 304 runs · 2 wkts
7121
J
James Hopes
QLD · 173 runs · 4 wkts
6116.5

Kieron Pollard
SOA · 153 runs · 6 wkts
4116.5

Dan Christian
SOA · 98 runs · 9 wkts
7107
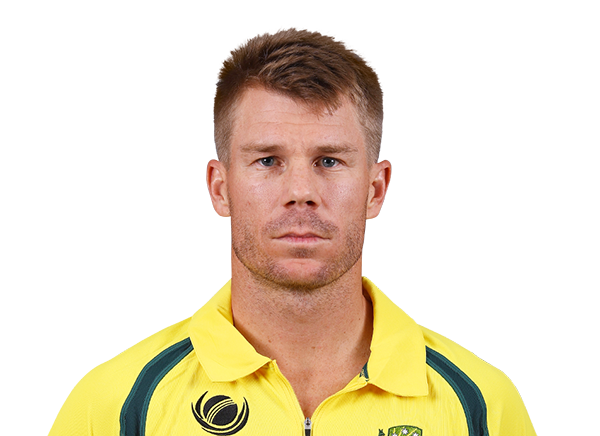
David Warner
NSW · 297 runs
8105
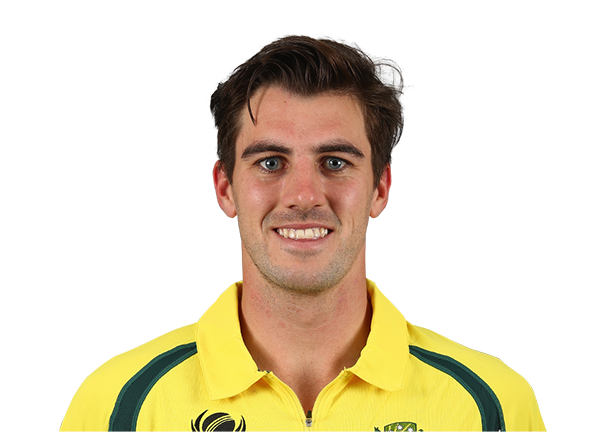
Pat Cummins
NSW · 3 runs · 11 wkts
6101.5
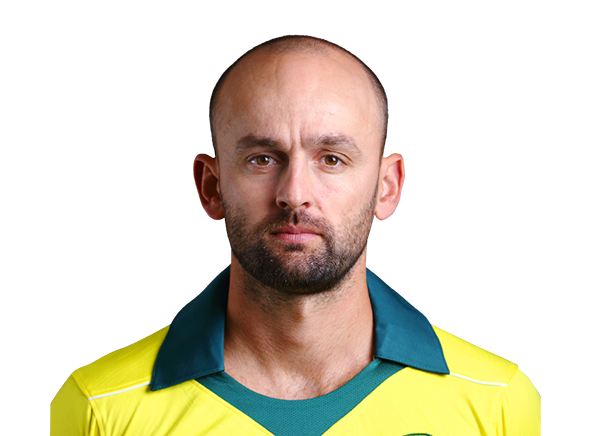
Nathan Lyon
SOA · 12 runs · 11 wkts
7101
A
Aaron O'Brien
SOA · 24 runs · 8 wkts
795
S
Stuart Clark
NSW · 4 runs · 9 wkts
795
J
James Hopes
QLD · 185 runs · 8 wkts
6114
D
Dirk Nannes
VIC · 0 runs · 7 wkts
7101.5
C
Chris Simpson
QLD · 139 runs · 4 wkts
6100.5
Kieron Pollard
SOA · 190 runs · 5 wkts
698.5

Shaun Tait
SOA · 7 runs · 8 wkts
692.5

Shahid Afridi
SOA · 48 runs · 7 wkts
591.5

Naved-ul-Hasan
TAS · 79 runs · 9 wkts
591.5

John Hastings
VIC · 4 runs · 10 wkts
787
Dan Christian
SOA · 54 runs · 6 wkts
686.5
A
Andrew McDonald
VIC · 118 runs · 7 wkts
786
A
Aaron Bird
NSW · 23 runs · 12 wkts
595
C
Chris Simpson
QLD · 65 runs · 8 wkts
590.5
S
Shane Harwood
VIC · 13 runs · 9 wkts
586
D
Daniel Harris
SOA · 200 runs
478
D
Dirk Nannes
VIC · 1 runs · 8 wkts
578
N
Nathan Rimmington
QLD · 0 runs · 8 wkts
576

Doug Bollinger
NSW · 0 runs · 6 wkts
472

Umar Gul
WA · 14 runs · 8 wkts
368.5
B
Brad Hodge
VIC · 217 runs
467.5
M
Mark Cameron
NSW · 15 runs · 4 wkts
567
League records
Since 2007 · 57 matchesB
Brad Hodge
Most runs · VIC · 21 matches
685
D
Dirk Nannes
Most wickets · VIC · 19 matches
26
David Warner
Most sixes · NSW · 16 matches
30
M
Michael Dighton
Highest score · vs New South Wales · 2007
113 (56)

Mitchell Marsh
Best bowling · vs New South Wales · 2010
4/6
We
Western Australia
Highest total · vs New South Wales · 2011
205/5
Big Bash (State Competition) 2010/11 Points Table, Fixtures & Results
Big Bash (State Competition) 2010/11 live scores, the current points table and results from 20 completed matches — updated live during every match, with full scorecards once it ends.
South Australia lead the table with 10 points from 6 matches (net run rate +1.438), ahead of Tasmania and New South Wales. 6 teams are competing this season.
The most recent match was South Australia vs New South Wales on 5 February 2011.
Big Bash (State Competition) 2010/11 fixtures and results
No upcoming matches
SOSouth Australia
155/2
NSNew South Wales
153/8
TATasmania
103/10
NSNew South Wales
107/1
NSNew South Wales
120/10
QLQueensland
124/2
VIVictoria
144/4
SOSouth Australia
147/5
TATasmania
170/7
WAWestern Australia
130/8
QLQueensland
170/5
WAWestern Australia
202/4
QLQueensland
123/9
NSNew South Wales
140/7
TATasmania
110/10
SOSouth Australia
112/1
VIVictoria
151/7
NSNew South Wales
168/7
SOSouth Australia
159/6
QLQueensland
149/9
NSNew South Wales
150/5
TATasmania
152/6
WAWestern Australia
146/4
VIVictoria
145/8
WAWestern Australia
156/9
SOSouth Australia
202/8
TATasmania
108/1
VIVictoria
107/8
NSNew South Wales
104/4
WAWestern Australia
205/5
SOSouth Australia
171/3
VIVictoria
116/10
QLQueensland
119/2
TATasmania
118/8
SOSouth Australia
147/10
NSNew South Wales
168/5
VIVictoria
188/4
QLQueensland
155/9
WAWestern Australia
126/10
TATasmania
189/6
Big Bash (State Competition) 2010/11 points table
#TeamPWLPTS
#TeamPWLNRNRRPTS